Improved snapshots: Select and compare any time span, drill down
When the performance of your application changes you want to know the reasons why. In the last month we have kept relasing feature after feature that makes this easy and quick and Snapshots was one of them.
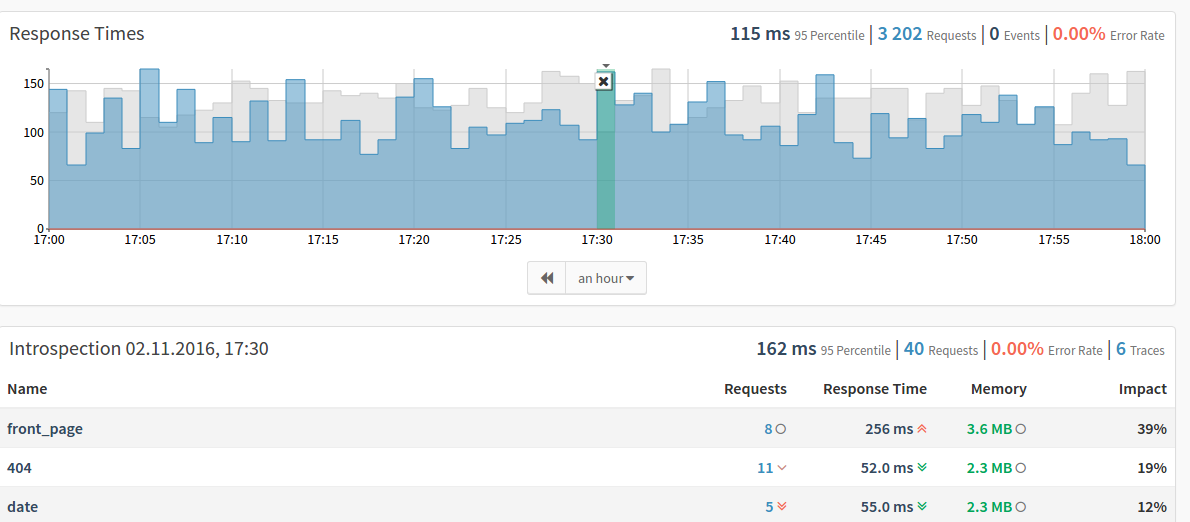
Clicking on any bucket in the application performance graph opens up a a view of the performance happening at the exact minute you selected.
Today we have significantly increased the value of this feature.
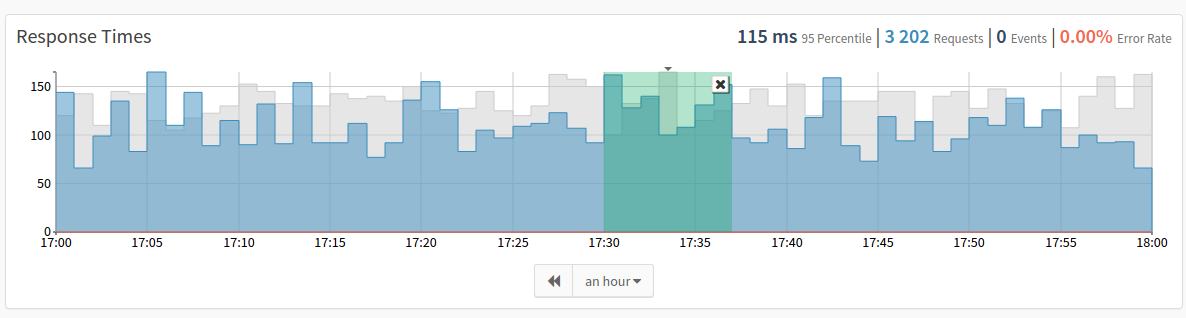
You can now select more than one minute in the application performance chart to view a performance snapshot of the entire selected time range. Keep the mouse pressed on the chart and start dragging it over all the time bucktes you are interested in.
The snapshot view then shows the response time, request amount, errors and details for each transaction in the selected time frame. Data from the snapshot is then compared to the values of the full time interval, which allows you to spot the outliers immediately.
If you then drill down into one of the transactions, you see the same time range immediately selected in the snapshot and the second box with the histogram shows performance data for just the requests happening in the selected time range.
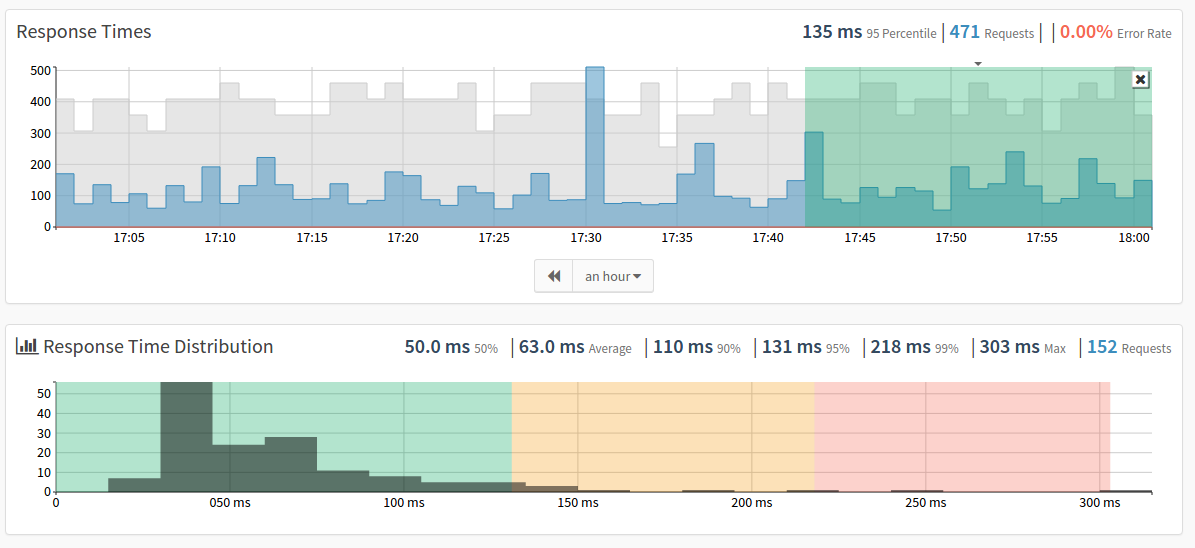
This includes median, average, max and all percentile values for requests that happend during the selected time range.
