Elasticsearch Outage analyzed
Yesterday morning the Profiler didn’t show data in the user-interface for about 7 hours. No data was lost, the workers just stopped importing while Elasticsearch went unresponsive.
We want to apologize that you could not rely on the data of our product for such a long span of time.
I want to take the time to explain the background of the outage, our response, and how we want to prevent this from happening again.
Background
We decided to use Elasticsearch for storing traces and performance data of the Profiler for several reasons:
- Simple clustering and sharding properties compared to MySQL
- ES has proven reliable for Time-Series use cases such as Graylog and Kibana
- Statistical aggregations (Percentiles) with good performance
- A big share can be attributed to trying out new technology as well, we started the Profiler as a side project after all.
Our inexperience with the technology led us to making two initial mistakes that are a necessary background to explain yesterday’s incident.
- The production cluster only used one index and one shard, so we didn’t actually make use of Elasticsearchs sharding feature at all, apparently leading to background jobs and queries requiring lots of RAM.
- Even when we used Graylog and Kibana as example for using timeseries with ES, we didn’t actually look at their concrete usage.
Our implementation for cleanups uses delete by query and required optimize with the only_expunge_deletes flag to rebuild the Lucene segments after each cleanup to reclaim disk space.
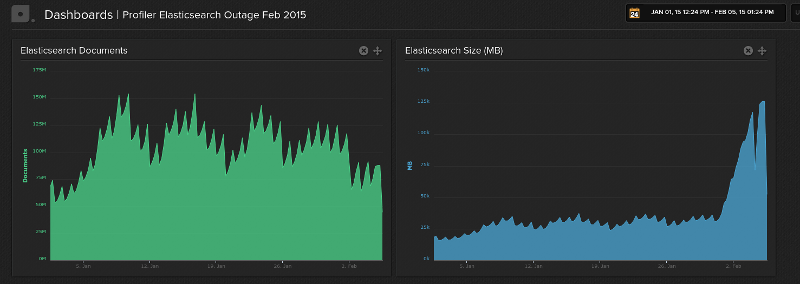
Every day in January about 50-75 million new documents were put into the same index and then deleted by date range query after their retention time was over. I have prepared two graphs that show the total number of documents and disk space used by Elasticsearch showing this behavior:
 Outage
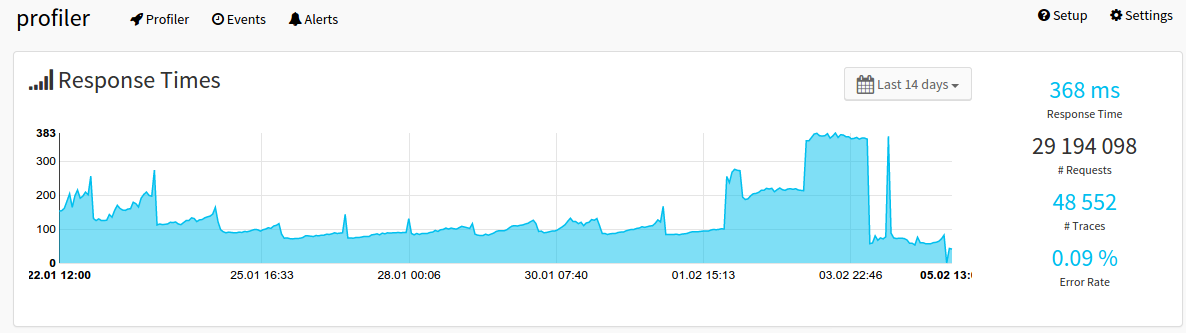
The “delete+optimize+expunge” operations are so expensive in Elasticsearch that we had a system wide spike in response times during this one hour time every day. You can see this overall response time (95% percentile) of the Profiler in the last 14 days:
 Outage
The spikes on the left show the exact dates of the cleanup job running, each day at midnight. The massive increase on the right side of the graph shows the response times due to failures starting Saturday.
The downside of our cleanup implementation was the memory requirements: With the steady increase of customers using the Profiler for big websites, we had to increase the RAM for Elasticsearch before from 4GB to 8GB and then 12GB . However, whenever the cleanup job failed due to out-of-memory, the problem increased. The next day when the job would run, documents of two days instead of one had to be optimized away.
Incident Timeline
Starting Saturday January 31st, we saw a massive increase in disk space used by Elasticsearch that we couldn’t account for in terms of documents. During January our cleanup job managed to keep the size of Elasticsearch at around 30-40GB, however during Saturday and Sunday it increased to 75GB of data.
You can see this on the right graph above when the spiking suddenly stopped and the disk space started increasing massively.
The “delete+optimize+expunge cleanup” started to fail on Sunday night at 01:30, because the process required too much disk space and the harddrive on one node went to 100% usage. The night shift of our hoster Syseleven reacted immediately, doubling the disk space of both nodes so that the Profiler could continue running uninterruptedly.
I couldn’t find out why the Elasticsearch disk size grew so much, but assumed it must be some kind of fault caused by our massive delete and optimize usage. When the number of documents every day stays roughly the same, the disk space should roughly stay at 40GB as well.
On Monday morning I removed the daily optimize+expunge from crontab and scheduled to work on a solution on when I had multiple consecutive days to work on the problem. I figured this timeframe would suffice with the increased disk space and no more OutOfMemory problems because of the halted job.
From Monday to Wednesday the database grew further from 75GB to 126GB and I suppose having just one shard for this amount of data is not what Elasticsearch can easily handle.
It was not a good idea to wait: On Wednesday 6:05 Europe/Berlin time our Elasticsearch cluster went down when it ran OutOfMemory and file descriptors. One node of the cluster did not recover from this error anymore and the other responded to queries with failure.
The workers processing the performance and trace event log data with Beanstalk message queue stopped.
The first immediate step was getting the system running again. Initially we couldn’t get the nodes to restart and queries were failing even after restarts. The cluster recovered at 9:50 after Syseleven increased the RAM of both nodes in the Elasticsearch cluster from 12GB to 32GB and the number of allowed file descriptors.
At 13:00 we restarted all the workers, at around 13:15 all data was up-to-date again.
Just increasing the RAM is obviously not the solution to the problem, which is why we worked on migrating the data in the last 24 hours to new indexes using more than one shard and making use of the Elasticsearch index alias and templating feature.
We didn’t have much tooling for our elasticsearch setup, so most of the deployment and migration code had to be written from scratch, which took me the full Wednesday. At 20:00 we started migrating data into new indexes, which was completed around 10:00 this morning. We had to restart one job multiple times to adjust the Scroll API usage for the best possible import performance.
Solution: Using Date-Based Indexes and Aliases
Our solution for fixing our one index/shard/cleanup problem: Instead of DeleteByQuery and Optimize/Expunge we create a new index for each day, week or month (depending on retention) and write documents to the index where they occured. These date based indexes need mappings and settings, which you can define using templates.
For example, our performance data is now saved in indexes with the naming schema measurements-$Year-$Month-$day. We have an index template that automatically adds mappings and settings to all indexes starting with measurements-*:
$ curl http://es1.profiler.qafoo:9200/_templates/measurements {
     "template": "measurements-*",
     "settings": { ... },
     "mappings": { ... },
     "aliases": {"measurements": {}}
}
When a new index measurements-2015-02-05 gets created it will use that settings and mappings automatically. Important here is the definition for index aliasing.
All reads on the Profiler will use the measurements alias instead of the date based indexes. This way the application doesn’t realize it is using multiple indexes in the background.
Now cleanup is just deleting old indexes, which is a simple file-based delete operation and requires no expensive operation inside Elasticsearch.
Another thing that we have started implementing with sharding in place is routing. We can easily partition all the data we have on a single profiled application into one shard. For big customers, their applications now fall onto different shards as well, which should hopefully lead to evenly distributed documents.
During the migration we set the _routing key for all the migrated documents. We will test if we can filter by routing key in queries without problems in the next days.
Be aware though that much of the conclusions we discussed here are applicable only when you use Elasticsearch as a time series database, not as a search database.
Monitor all the things
We are lucky to catch most of the issues directly, because of our own monitoring with Librato/Opsgenie and Syseleven Nagios Monitoring. However, with every incident, you find new ones for your tool belt:
- For Elasticsearch it is important to monitor the number of used file descriptors as percentage of all the handles available.
- The max size of a shard in Elasticsearch could be an indicator for required resharding. It depends a lot on each use case though, there is no hard rule here.
Summary
The take away from this outage is: Know your database. We have been using Elasticsearch naively for the last months and paid the price now having to redesign the whole persistence in 24 hours. What saved us from a failure with data loss is that we did not trust Elasticsearch with our data to begin with, saving event logs to disk and putting a queue in between.
